


After comparing six multi-cloud cost visibility platforms by use case, one thing is clear: the right tool depends entirely on where your cost problem actually lives.
6 multi-cloud cost visibility tools: Quick comparison
table-tbc
How we evaluated these multi-cloud cost visibility tools
Instead of scoring every platform against the same feature checklist, we grouped them by the cost problem each one is actually built to solve. For each tool, we looked at:
- What spend it makes visible and at what level of detail
- What allocation or governance action it enables from that visibility
- Where the tool's scope ends and what it leaves uncovered
- How well it fits the team type most likely to buy and use it
The goal isn't to find one winner but to match the right tool to the right problem so you're not buying allocation tooling when your real issue is unit economics.
The 6 best multi-cloud cost visibility tools
1. Finout: Best for shared-cost allocation
Finout fits teams that already know cloud spend is spread across providers, services, and shared infrastructure, but cannot allocate it cleanly. Its MegaBill, virtual tags, and shared-cost reallocation help turn pooled spend into showback or chargeback views that finance and engineering can both use.
Key features
- MegaBill consolidates cloud and related infrastructure spend into one cost view.
- Virtual tags help allocate costs even when native provider tags are incomplete.
- Shared-cost reallocation helps distribute common infrastructure costs across teams, products, or services.
- Anomaly detection and dashboards support day-to-day FinOps monitoring.
What users say
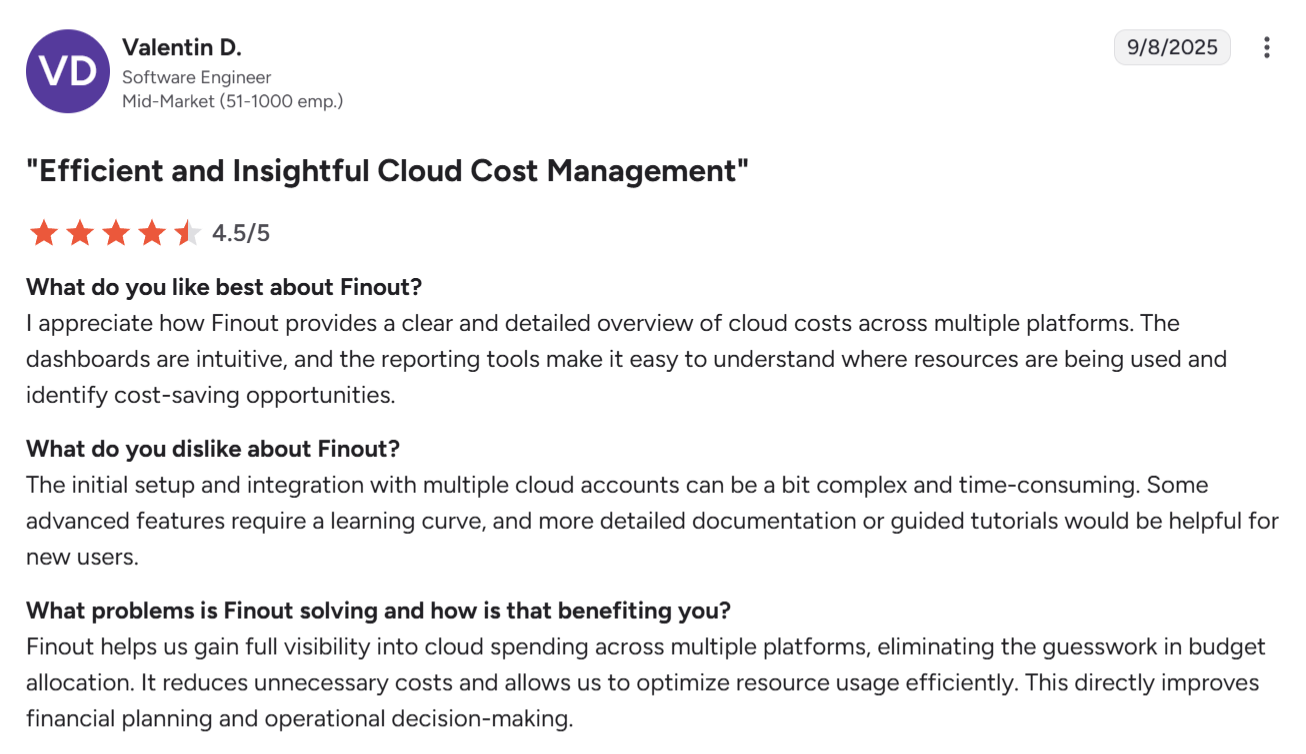
“Finout provides a clear and detailed overview of cloud costs across multiple platforms.” — Valentin D., software engineer, G2
“Some of the more advanced features took a bit of time to get the hang of.” — Luis S., staff SRE, G2
Pros
- ✅ Strong allocation layer for shared costs and virtual tagging.
- ✅ Useful for showback and chargeback workflows.
- ✅ Good fit when native tags are inconsistent or incomplete.
Cons
- ❌ Building custom cost allocation queries for shared infrastructure can require multiple configuration steps.
- ❌ Less focused on hybrid IT governance across SaaS and on-prem environments.
Best for
Teams that need shared-cost allocation, virtual tagging, and showback more than broad hybrid IT governance.
2. CloudZero: Best for unit economics
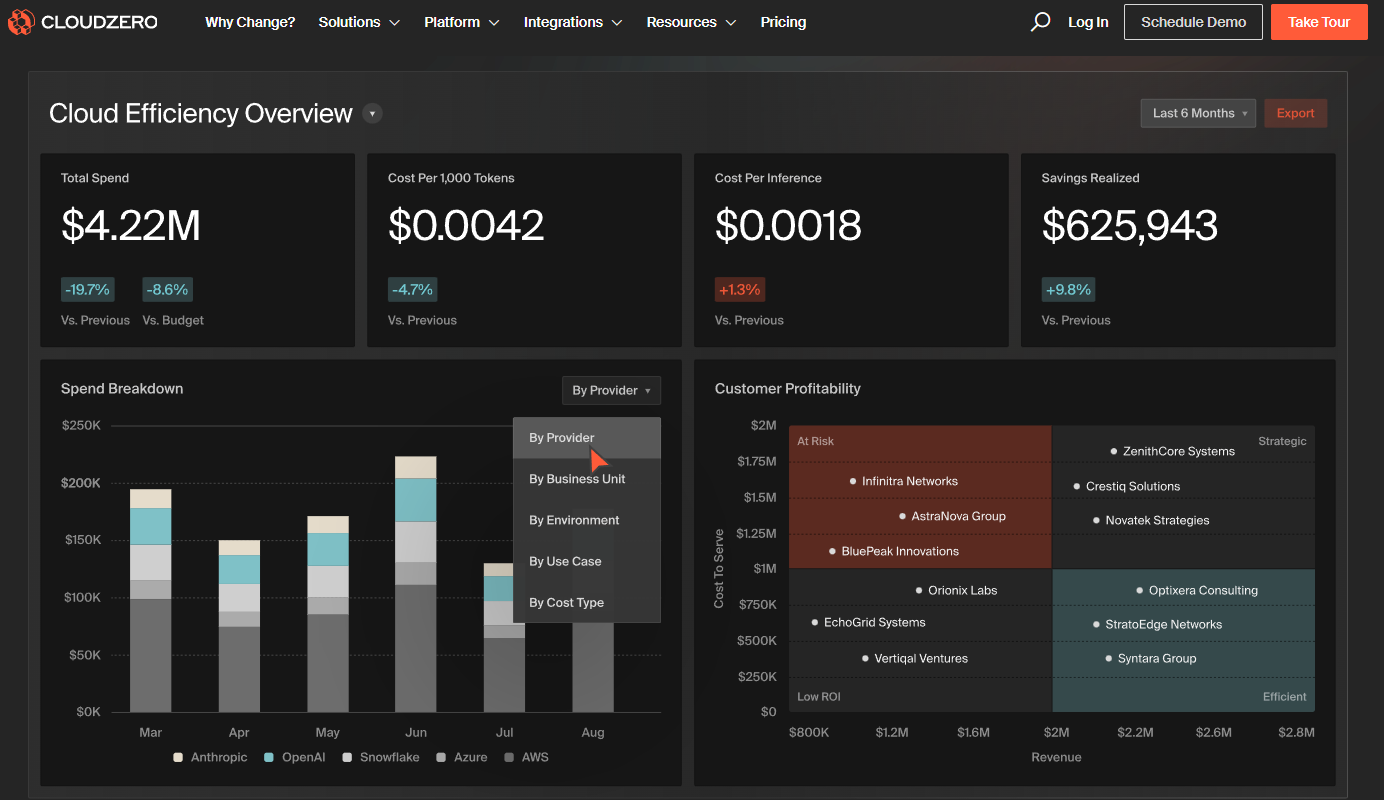
CloudZero pulls cloud spend out of the account-and-service view and reorganizes it around the things the business actually sells: customers, features, products, transactions. It is strongest when the question is not only where spend landed, but what it cost to serve a customer, ship a feature, run a product, or process a transaction.
Key features
- CostFormation allocates 100% of cloud spend to business units (customers, features, products, or teams) without requiring perfect tagging.
- AnyCost ingests billing data from any cloud provider, normalizes it into a common model, and combines it with usage telemetry for unit-cost analysis.
- Dimensions let teams split shared, Kubernetes, and untagged costs across business contexts using code-driven rules rather than native tags.
- Anomaly Detection flags abnormal spend events down to hourly granularity and surfaces root-cause investigation directly in the platform.
What users say
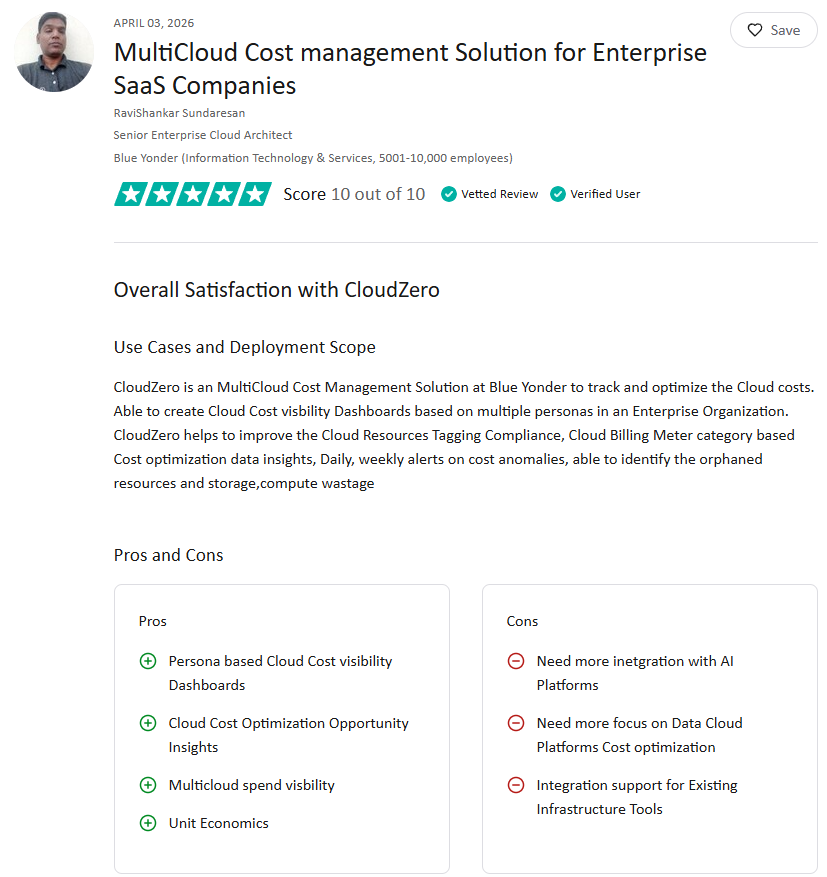
“CloudZero helps to improve cloud resource tagging compliance, cost optimization insights, and daily or weekly cost-anomaly alerts.” — RaviShankar Sundaresan, senior enterprise cloud architect, TrustRadius
“Limited ability to view detailed usage metrics directly from the regular Explorer dashboard.” — Pankaj K., network operations manager, G2
Pros
- ✅ Strong fit for product and SaaS teams that care about gross margin and customer profitability.
- ✅ Useful for mapping cloud spend to products, features, teams, and business metrics.
- ✅ Handles Kubernetes and shared-cost allocation better than basic provider-native reporting.
Cons
- ❌ Less focused on policy-driven governance than IBM Cloudability or Flexera.
- ❌ Initial configuration, especially for custom unit metrics and allocation rules, can take time to tune for teams that want simpler reporting workflows.
Best for
Product-led teams that need cloud cost visibility by customer, feature, product, transaction, or team.
3. IBM Cloudability: Best for mature enterprise FinOps
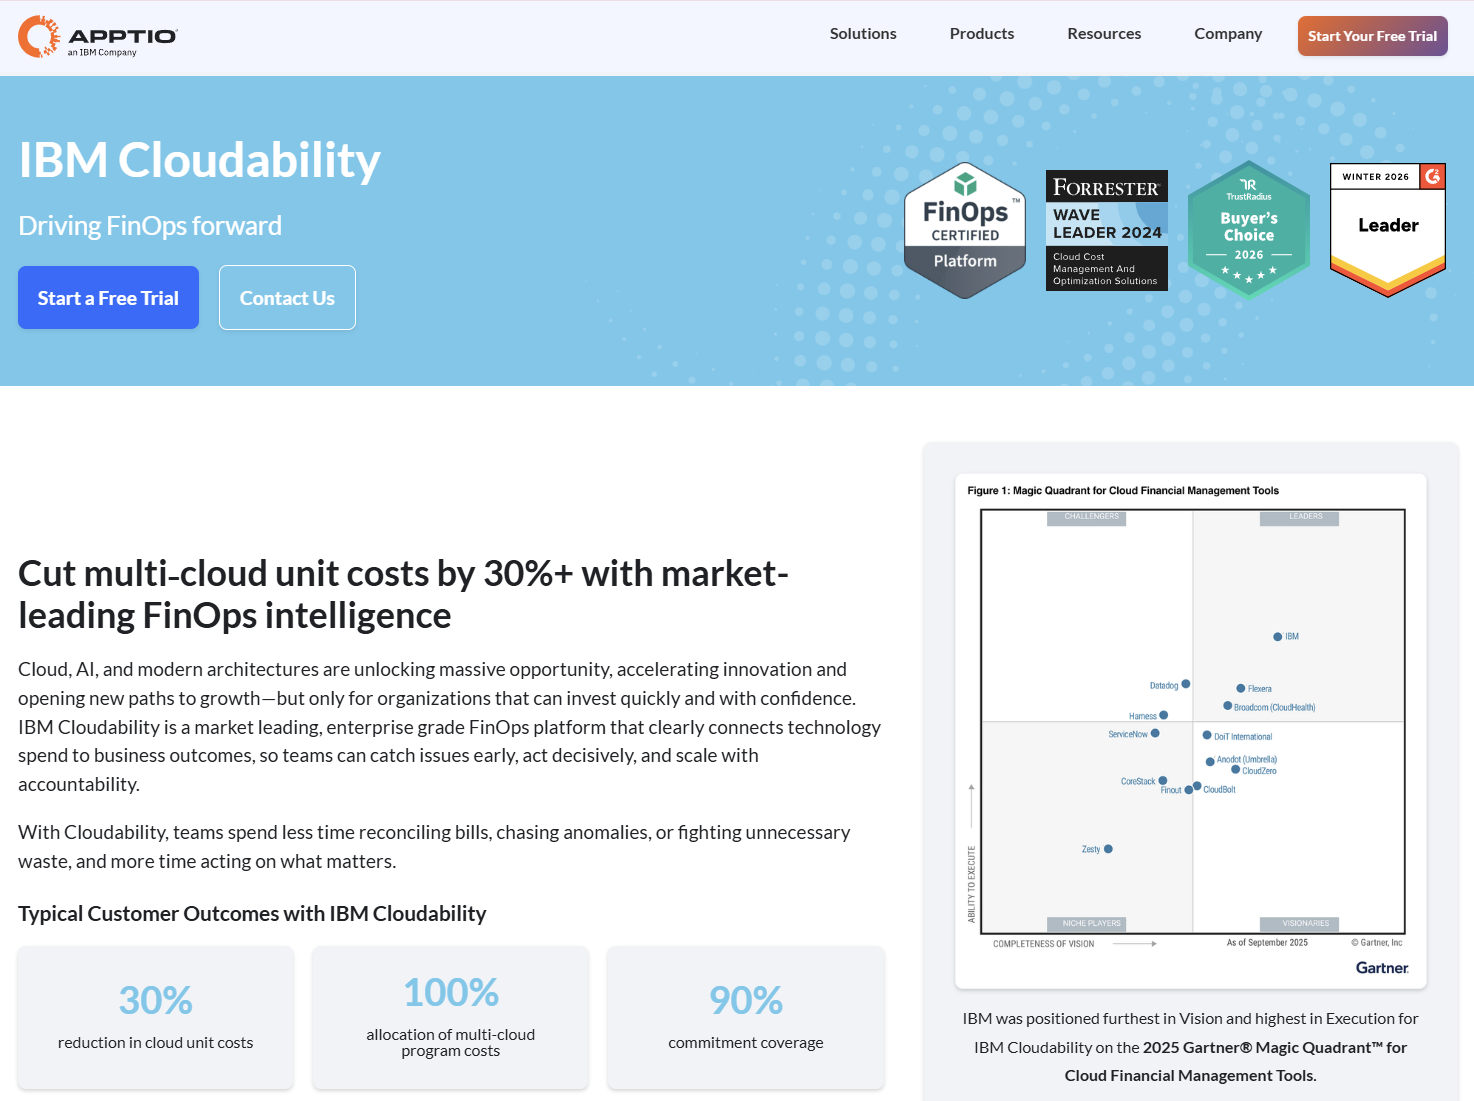
IBM Cloudability is built for the stage where FinOps becomes a cross-functional operating model: multi-cloud visibility, Kubernetes and AI spend analysis, showback and chargeback, and commitment planning across finance, engineering, and platform teams. If the program is already running and needs infrastructure at enterprise scale, this is the platform built for that.
Key features
- Cost allocation covers multi-cloud, Kubernetes, and AI spend, including shared costs and support charges, and maps it to teams, cost centers, or business units for showback and chargeback.
- Rightsizing recommendations surface underutilized resources across providers and let teams assign, track, and action them directly in the platform.
- Commitment management forecasts reserved instance and savings plan coverage gaps and recommends adjustments to reduce on-demand spend.
- Anomaly detection flags unexpected spend changes across accounts and services, with enough drill-down to identify the root cause without leaving the platform.
What users say
“We use IBM Cloudability for Cloud Cost transparency, show back/chargeback, resource optimization, budgeting/forecasting.” — Grant Havrilenko, FinOps analyst, TrustRadius
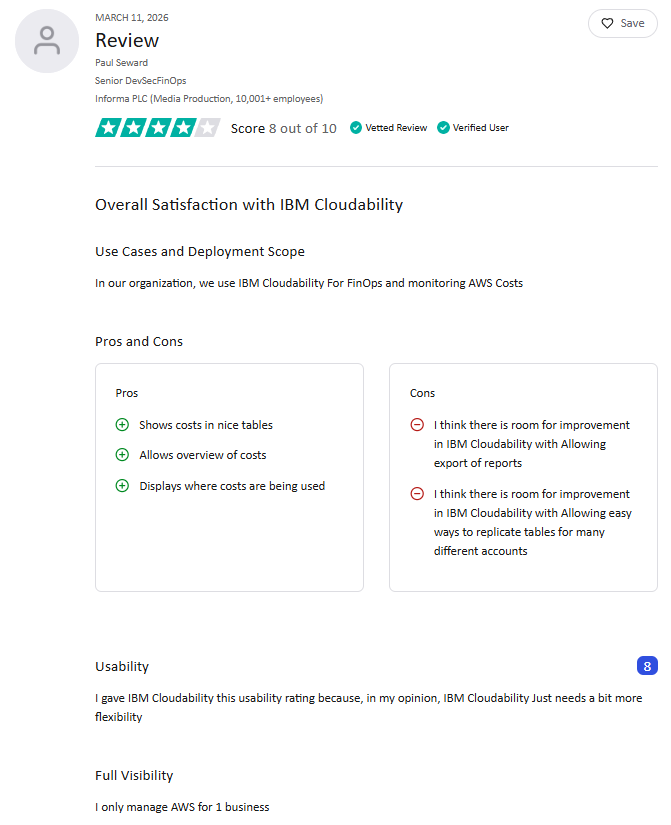
“I think there is room for improvement in IBM Cloudability [by] allowing easy ways to replicate tables for many different accounts.” — Paul Seward, senior DevSecFinOps, TrustRadius
Pros
- ✅ Covers the full FinOps operating model in one platform: allocation, forecasting, rightsizing, and chargeback without stitching tools together.
- ✅ Finance, engineering, and leadership teams work from the same cost data, which eliminates the reconciliation that slows down cross-functional programs.
- ✅ Useful when teams need chargeback, showback, commitments, and container-cost visibility in one operating layer.
Cons
- ❌ Getting full value requires a dedicated FinOps function; it's not a tool you stand up and hand to engineers.
- ❌ AI cost analysis features are newer and may not have the same depth or reliability as the core FinOps reporting layer.
Best for
Enterprises that need mature FinOps workflows, commitment management, showback or chargeback, and Kubernetes cost visibility across large cloud environments.
4. Flexera: Best for hybrid IT governance
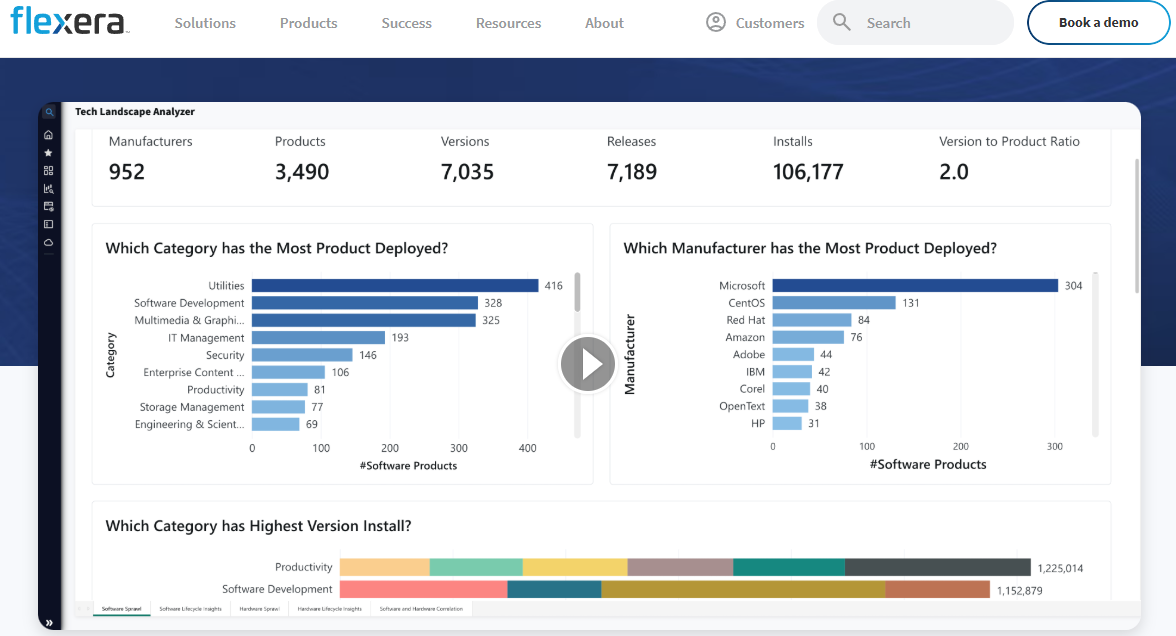
Flexera is for enterprises where cloud spend can't be evaluated in isolation. It sits alongside SaaS contracts, on-prem infrastructure, and software licenses that all hit the same budget. Its policy-based governance and hybrid portfolio view make it the right call when cloud cost visibility is only part of the ask.
Key features
- Cost allocation and tagging covers AWS, Azure, Google Cloud, SaaS, and on-prem spend, giving teams a single view across the full technology portfolio.
- Waste identification surfaces idle and underutilized resources with recommendations teams can act on directly.
- Policy-based automation triggers cost, security, and compliance actions across cloud environments without manual intervention.
- Hybrid IT portfolio visibility connects cloud spend to broader technology costs (software licenses, SaaS, and on-prem infrastructure) in one governance layer.
What users say
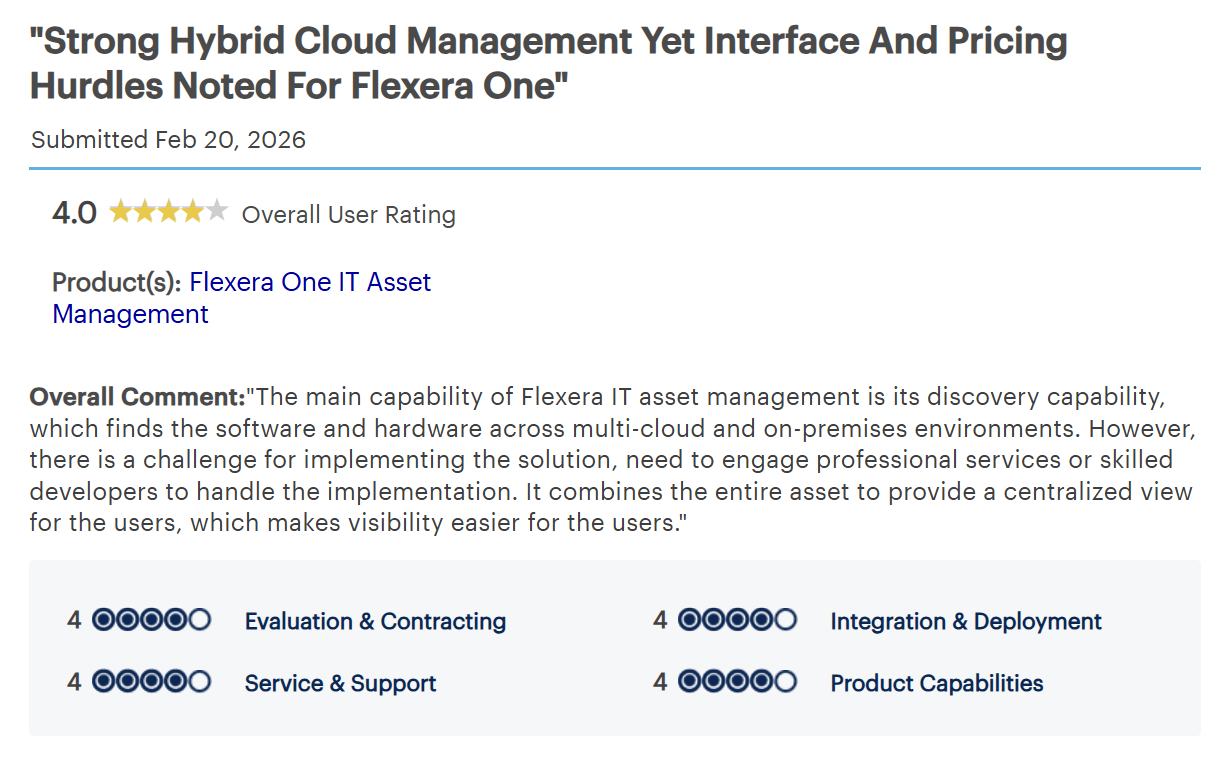
“It combines the entire asset to provide a centralized view for the users, which makes visibility easier for the users.” — Systems engineer in IT services, Gartner Peer Insights
“Ongoing maintenance is difficult to handle.” — Tripti Kashaudhan, SDE, TrustRadius
Pros
- ✅ Strong fit for enterprises managing cloud plus SaaS and on-prem spend.
- ✅ Policy-based automation means cost, security, and compliance actions happen at the governance layer.
- ✅ Useful when policy actions and commitment management matter.
Cons
- ❌ Teams that only need cloud cost reporting may find the platform's hybrid IT scope adds complexity without proportional value.
- ❌ Setup and onboarding require significant effort and dedicated resources before teams see consistent value.
Best for
Enterprise teams that need cloud cost visibility tied to hybrid IT governance.
5. Vantage: Best for engineering-led cost workflows
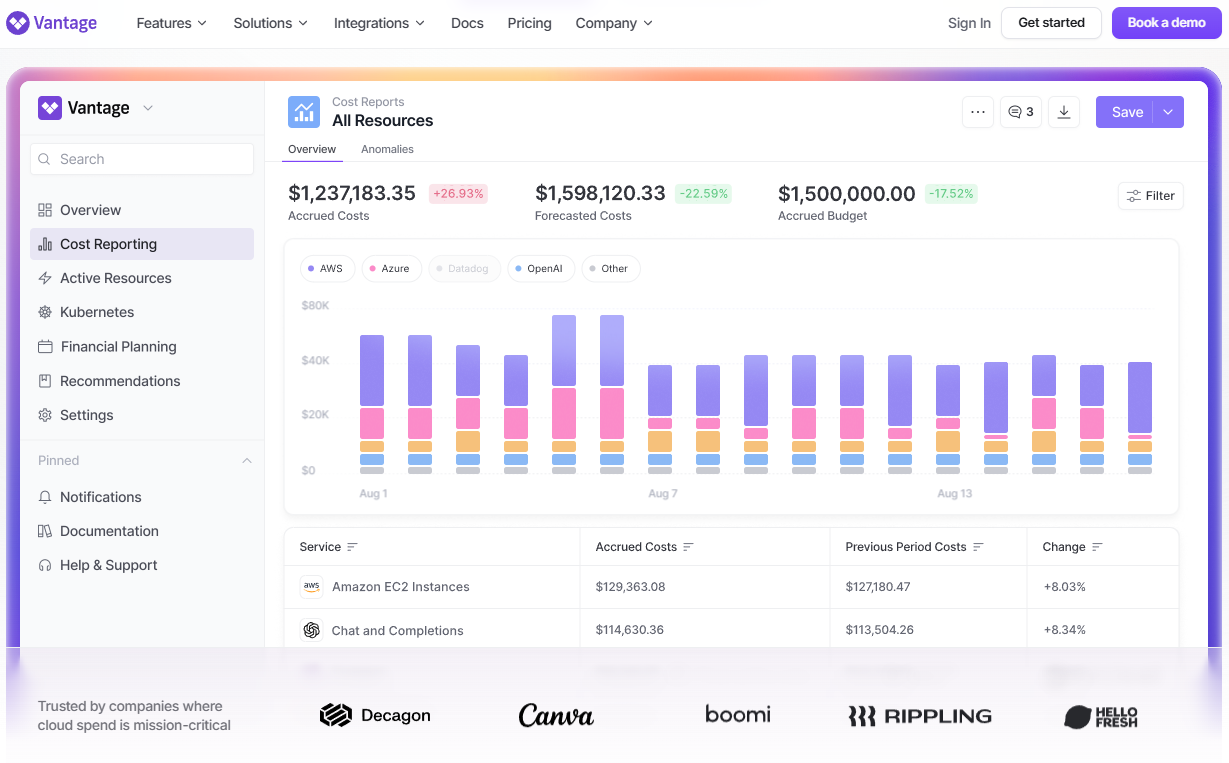
Vantage is built for engineering and platform teams who want cost reporting to work the way their other tooling does: self-service, code-driven, and close to where the work happens, with virtual tagging, Kubernetes cost detail, and a Terraform provider for teams that manage infrastructure as code.
Key features
- Self-service cost reports, forecasts, and attribution across AWS, Azure, and Google Cloud; no FinOps team required to pull a number.
- Virtual tags fill the gaps where native provider tagging is incomplete, so allocation doesn't depend on perfect tagging discipline.
- Segments support hierarchical cost reporting that maps to how engineering orgs are actually structured: teams, services, environments.
- Slack, Jira, Microsoft Teams, and email integrations bring cost alerts into the workflows teams already use.
- Terraform integration lets engineering teams manage cost reporting the same way they manage infrastructure through code, versioned, and reviewable.
What users say
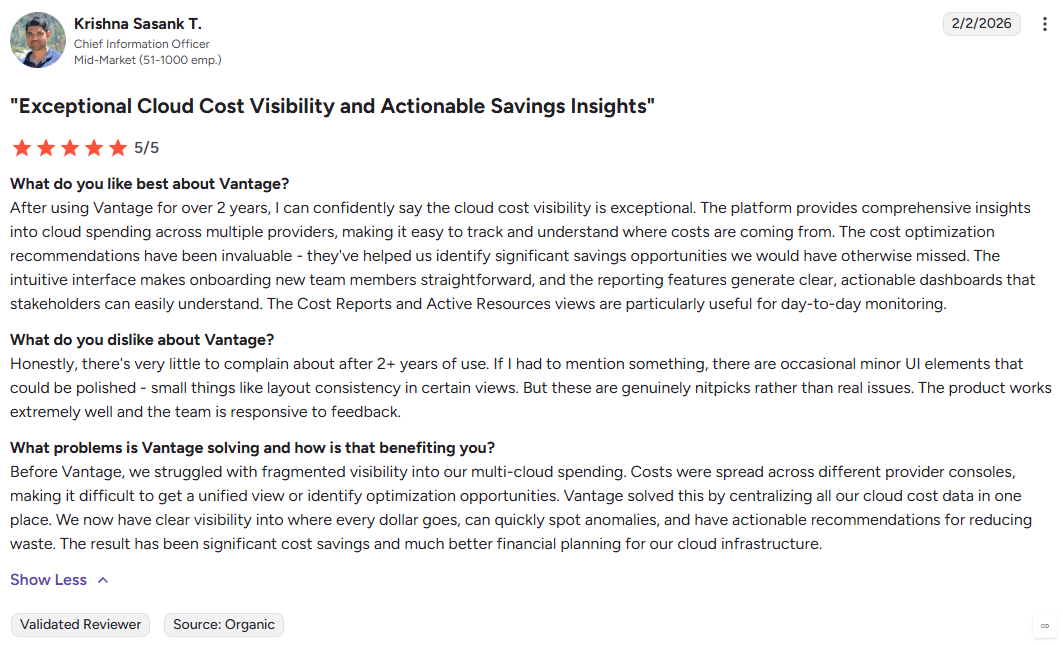
“After using Vantage for over 2 years, I can confidently say the cloud cost visibility is exceptional.” — Krishna Sasank T., Chief Information Officer, G2
“Some of the data they need to report includes custom routes.” — Abhishek, DevSecOps, PeerSpot
Pros
- ✅ Faster to adopt than most FinOps platforms; engineers can get meaningful cost visibility without a dedicated FinOps team standing it up.
- ✅ Covers the allocation gaps that trip up most cloud cost tools: incomplete native tags, shared Kubernetes costs, and multi-provider spend in one view.
- ✅ One of the few cost platforms with a Terraform provider, which matters for teams that treat their tooling configuration as code.
Cons
- ❌ Dashboard customization may need more work for teams with complex reporting preferences.
- ❌ Less suited to broad hybrid IT governance across SaaS and on-prem than Flexera.
Best for
Engineering-led teams that need self-service reporting, virtual tagging, Kubernetes cost detail, and Terraform-based FinOps workflows.
6. Datadog Cloud Cost Management: Best for cost observability
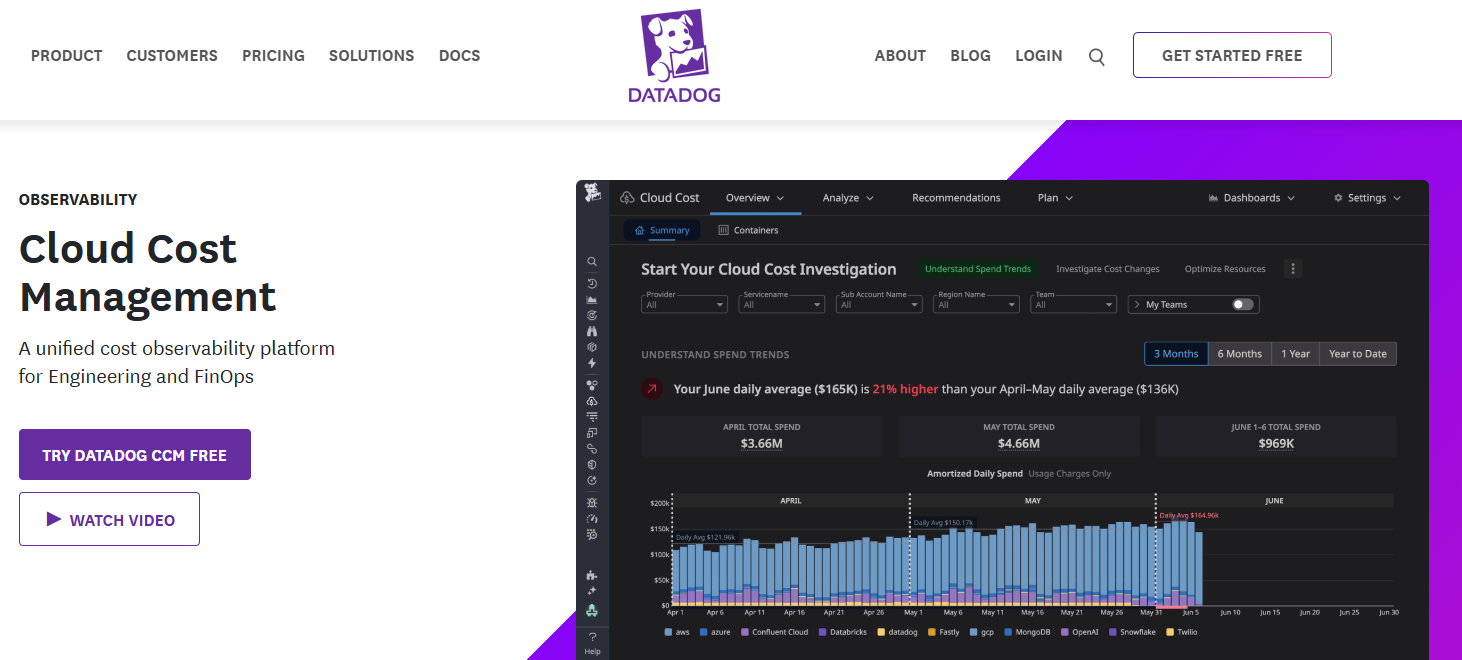
Datadog Cloud Cost Management puts spend data inside the operational workflow engineers are already in: queryable alongside performance data, visible to the people making the decisions that drive it. It's the natural pick for teams already deep in Datadog who want cost and infrastructure context in the same place.
Key features
- Cost data lives inside Datadog as queryable metrics, so engineers can correlate spend directly with the performance data they're already watching.
- Cost views break down by provider, account, region, service, team, and Kubernetes spend; no context-switching to a separate tool to get the full picture.
- FOCUS support standardizes ingestion of any cost source in the FOCUS format, alongside native AWS, Azure, Google Cloud, OCI, and SaaS cost data.
What users say
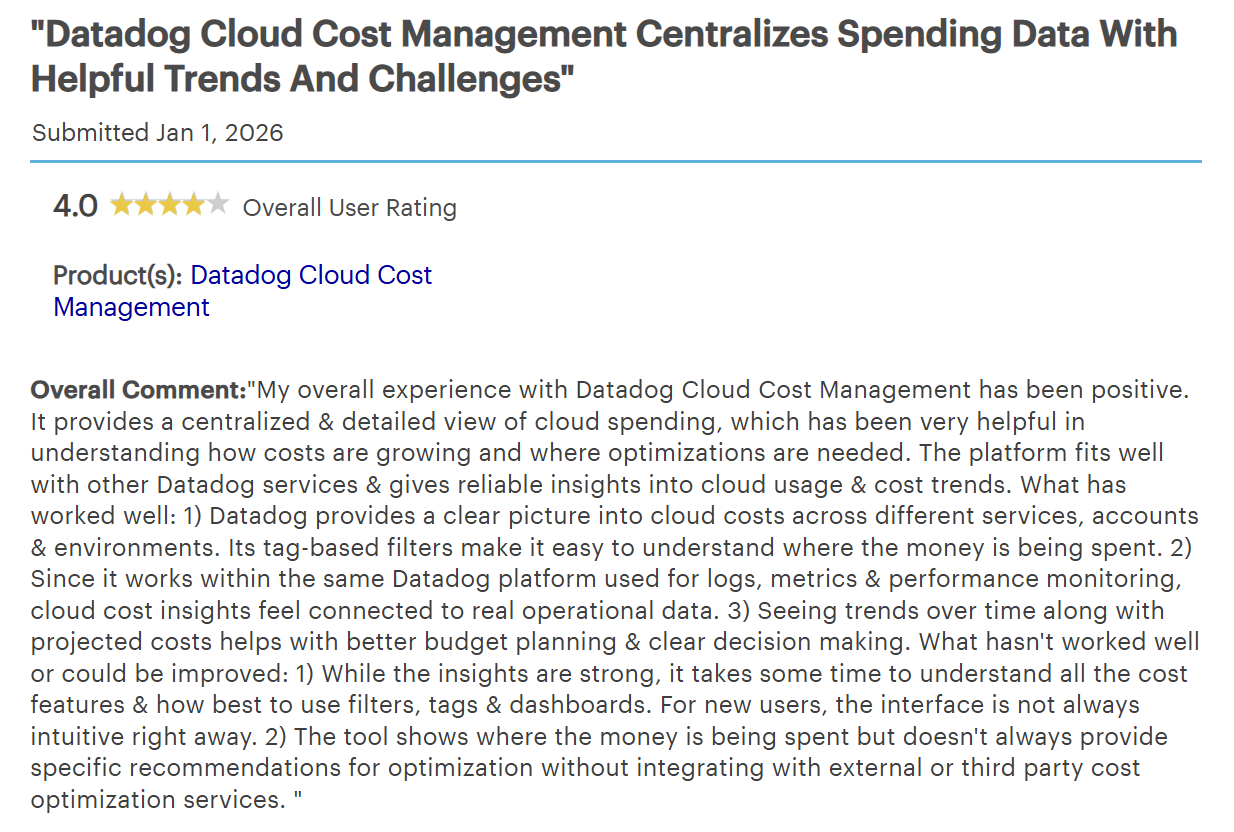
“The ability to customize which metrics and logs we ingest helps us to manage/control the cost effectively.” — Gilan Pharmacy, system engineer, TrustRadius
“It takes some time to understand all the cost features & how best to use filters, tags & dashboards.” — Director in IT services, Gartner Peer Insights
Pros
- ✅ Zero additional context-switching for teams already in Datadog
- ✅ Correlating a cost spike with a performance change is native behavior here, not a manual exercise across two tools.
- ✅ Adoption tends to be faster for engineering-led organizations because the interface is already familiar.
Cons
- ❌ Less compelling if teams do not already use Datadog heavily.
- ❌ Not the broadest fit for enterprise governance outside observability-led workflows.
Best for
Teams that want cloud cost visibility inside their existing infrastructure and observability workflow.
What multi-cloud cost visibility tools need to do
Multi-cloud cost visibility has to answer three questions: where spend lands, who owns it, and what action reduces it. FOCUS helps standardize billing data across providers, but the enforcement and allocation work still happens in the tools built around it.
Native cloud tools cover the basics when one provider dominates. They break down when spend is fragmented and the cost problems underneath it start compounding across teams and environments.
That last category is worth calling out separately. For cloud-first teams, the backup layer is often where visibility gets weakest and costs keep climbing without a clear owner.
Which multi-cloud cost visibility tool should you choose?
If one provider still dominates your environment and your team can maintain its own FOCUS-based reporting layer, native cloud tools may be enough to start.
- Choose Finout if allocation, shared costs, and virtual tagging are the blocker.
- Choose CloudZero if the real question is cost per customer, feature, or product.
- Choose IBM Cloudability if you need mature enterprise FinOps workflows, commitment management, and chargeback depth.
- Choose Flexera if hybrid IT governance matters as much as cloud spend visibility.
- Choose Vantage if engineering teams need self-service reporting, Kubernetes detail, and everyday adoption.
- Choose Datadog if cost needs to sit inside the same operational workflow as observability data.
What these tools don't cover: backup posture and recovery cost
The six tools in this guide are built to answer FinOps questions: where spend landed, who owns it, and what can be optimized. They do that well.
What they don't reach is the backup layer. And for cloud-first teams running multi-account, multi-region environments, that's where a significant and often invisible cost problem lives.
The issue isn't that backup spend doesn't show up in a FinOps dashboard. It does, as a line item. The problem is that a line item doesn't tell you why it's growing, whether your coverage is actually current, or whether you can recover the right data when something goes wrong.
Retention policies drift as environments change. Resources get added without triggering policy updates. Restore workflows default to full-environment recovery when teams only needed a single file or database record. None of that is visible from an allocation or unit-cost view.
That's the gap Eon closes.
Eon is the backup posture and cost layer for cloud-first teams where fragmented coverage, retention drift, and restore inefficiency are the real cost drivers across AWS, Azure, and Google Cloud.
- Cost Explorer gives instant visibility into backup spend by account, region, and workload across AWS, Azure, and Google Cloud, so teams can trace what is driving a growing backup line item and charge it back without manual reporting.
- Cloud Backup Posture Management (CBPM) discovers and classifies resources and enforces policy without manual tagging, so coverage stays current as the environment changes instead of drifting out of sync.
- Granular recovery restores a single file, object, record, or database table without rehydrating the full environment, so recovering the right data doesn't mean paying to rebuild everything around it.
NETGEAR ran into this problem at scale: limited visibility into backup spend, recovery times of up to 24 hours for instances over 10TB, and operational overhead from a legacy stack. After deploying Eon, they cut backup storage costs by 35% and reduced recovery time for a mission-critical 10TB SQL Server database by 88% (from roughly 24 hours to under three).
If backup posture, retention growth, and restore workflows are driving spend that your FinOps platform surfaces but can't fix, that's where Eon fits.
Book a demo to see how Eon identifies backup-policy drift, cost hotspots, and granular recovery options across your cloud environment.
Frequently asked questions
What is a multi-cloud cost visibility tool?
A multi-cloud cost visibility tool is a platform that brings billing and usage data from multiple cloud providers into one view. The stronger tools also allocate shared costs, map spend to teams or products, and highlight waste before it grows.
Are native cloud cost tools enough for multi-cloud reporting?
Sometimes. Native cloud cost tools are often enough when one provider still dominates your environment, or when your team can maintain its own FOCUS-based reporting layer. They become less useful when cross-cloud allocation turns manual or when backup posture and recovery cost are the bigger problem.
What is FOCUS in cloud cost management?
FOCUS in cloud cost management refers to the FinOps Open Cost and Usage Specification. It puts billing data from different providers into a more consistent format, so teams do not have to reconcile each export by hand.
Which tools are strongest for shared costs and chargeback?
Finout, IBM Cloudability, and Flexera are the strongest for shared costs and chargeback in this comparison. Finout leans hardest into virtual tagging and shared-cost reallocation, while IBM Cloudability and Flexera put more weight on enterprise governance and broader showback or chargeback workflows.
When does backup posture become a cost visibility problem?
Backup posture becomes a cost visibility problem when over-retention, policy drift, redundant copies, and restore-first workflows keep pushing costs up across clouds. That is where Eon becomes relevant, because it ties cost control to CBPM, immutable backups, granular recovery, and queryable backup data.